How are Bollinger Bands used in forex trading?
Bollinger Bands are popular with technical analysts and traders in all markets, including forex. Since traders of currency look for very incremental moves to profit, recognizing volatility and trend changes quickly is essential. Bollinger Bands help by signaling changes in volatility. For generally steady ranges of a security, such as many currency pairs, Bollinger Bands act as relatively clear signals for buying and selling. This can result in stop-outs and frustrating losses, though, so traders consider other factors when placing trades in relation to the Bollinger Bands.
Setting Limits
First, a trader must understand how Bollinger Bands are set up. There is an upper and lower band, each set at a distance of two standard deviations from the security’s 21-day simple moving average. Therefore, the Bands show the volatility of the price in relation to the average, and traders can expect movements in price anywhere between the two bands. Forex traders can use the bands to place sell orders at the upper band limit and buy orders at the lower band limit. This strategy works well with currencies that follow a range pattern, but it can be costly to a trader if a breakout occurs.
Reading Volatility
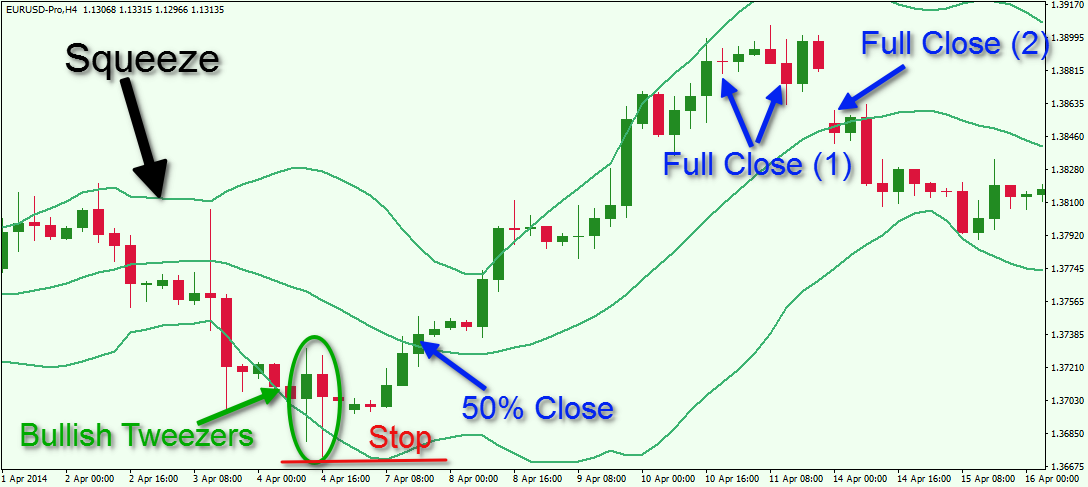
Since Bollinger Bands measure deviation from the average, they react and change shape when price fluctuations increase or decrease. Increased volatility is nearly always a sign that new normals will be set, and traders can capitalize using Bollinger Bands. When the Bollinger Bands converge on the moving average, indicating lower price volatility, it is known as “the Squeeze.” This is one of the most reliable signals given by Bollinger Bands, and it works well with forex trading. A Squeeze was seen in the USD/JPY currency pair on Oct. 31, 2014. News that the Bank of Japan would be increasing its stimulus bond-buying policy sparked the trend change. Even if a trader did not hear about this news, the trend change could be spotted with the Bollinger Band Squeeze.
Backup Plans
Sometimes reactions are not as intense, and traders can miss profits by setting orders directly on the upper and lower Bollinger Bands. Therefore, it is wise to determine entry and exit points near these lines to avoid disappointment. Another Forex trading strategy to work around this is to add a second set of Bollinger Bands placed only one standard deviation from the moving average, creating upper and lower channels. Then, buy orders are placed within the lower zone and sell orders in the upper zone, increasing execution probability.
There are several other specific strategies used in currency trading with Bollinger Bands, such as the Inside Day Bollinger Band Turn Trade and Pure Fade Trade. In theory, these are all profitable trades, but traders must develop and follow the methods exactly in order for them to pan out.
Bollinger Bands Strategy in Forex Trading
The forex trading market is the most predominant in the contemporary economy. A huge population of people is now actively migrating toward this market. The players of the market have presented the marketplace for foreign exchange trade to be very promising with greater chances of raising income. The mechanism under which trade operates is taking advantage of slight changes in currencies and making huge deals out of it.
To achieve this to the brim, financial analysts always incorporate the usage of Bollinger Bands strategy. The technicality in the form of Bollinger Bands is what has increased its usage in determining trends the currencies will take. The main objective behind its application is to assist traders when determining when to enter and when not to enter a market.
The initiation of the Bollinger Bands trading strategy can be traced back to the 1980s by its founder John Bollinger who created it intending to closely analyze the volatility and movement of the stock exchange.
What are Bollinger Bands?
A Bollinger Band is an analytical method that is designed to study the movement and volatility of financial instruments over some time. The mechanism of operation of this method strictly functions under a formula that was created by John Bollinger. A huge number of people are actively using it. With the application of this method, useful charts showing the maximum and minimum averages can be displayed simplifying analysis to a greater level.
The trend that the strategy of Bollinger Bands would normally assume is the upper band, the middle band, and the lower band. The middle band parameters are normally chosen by the trader since it is a moving average. On the other hand, for the lower and upper band, it is the sole responsibility of the trader to choose the number of standard deviations that volatility needs to be set at.
Depending on how these bands behave, analysts can be able to comfortably determine how low or high the prices will move.
Common uses of Bollinger Bands are:
- They are utilized for comparisons of price actions in various technical indicators.
- They help in the accurate identification of overbought and oversold conditions.
- They are known to generate trading indicators.
- They also assist to determine whether the price is fluctuating or trending.
- They create an algorithm trading solution for dealing with forex exchange simplifying analyst work to a greater magnitude.
- They generate patterns that are useful in foreign exchange trading decision-making.
- With the Bollinger Bands strategy, investors can identify currency pairs that can either reap high or lower prices.
- Investors can conclusively determine periods that will experience either low or high volatility.
- Production of useful trading indications of progressive traders. This can be facilitated through the use of Bollinger squeeze or bounce.
How do these indicators work? Before getting into deep details, it is important to know that Bollinger Bands weigh the level of lowness and highness.
- The upper band indicates that prices are high or inflated;
- The lower bands can be interpreted as being low or inexpensive.
- The higher the volatility in the market, the wider the Bollinger Bands, and the less the volatility in the market, the narrower the Bollinger Bands are expected.
When the economy is witnessing low volatility and the situation forces the bands to tighten, the probability of sharp price movements on either side is to be expected. During the trend period, it is of importance to watch out for a false trend move that may shift direction abruptly.
To determine the ending of an existing trend, study the chart carefully, and if by any chance the variance is of an unusually large amount, then that’s the break-even.
Spotting a possible profit target is very easy with Bollinger Bands strategy. Study how the prices are bouncing from one band to another and you will get a clear indicator of which one to consider investing in. A good example is when a price bounces from the lower price and it exceeds the average cost, then definitely the upper band automatically becomes our target
There are some times when prices tend to hug the strong trends for a long time. This situation doesn’t necessarily mean people invest more, it calls for a prudent analyst to carefully analyze this trend and determine what is causing this trend. If it turns out to be safe, they can continue with indulgence in this trade, but if not, they should halt such decisions.
Calculation of Bollinger Bands
The Bollinger Band formula is composed of two moving standard deviations and one average. To be able to understand Bollinger Bands well, it is important to know how to:
- Calculate period simple moving average;
- Compute standard deviation;
- Apply standard deviation in computing the lower and the upper band.
To determine the standard deviation, we need to determine the X bar in the formula
X=SUM/N
The result of the above computation is the same as the standard moving average.
The sum represents the value of the periods involved; they could vary depending on the times. If the values turn out to be 10, then we must add up the values together to find the total sum.
N is the number of periods that are applicable in this case.
The next procedure is finding the standard deviation, which is calculated with the below formula:
- S represents the standard deviation.
- The symbol inside the brackets represents the summation. The idea behind its significance is that whatever is in the bracket should be treated the same and added up at the end.
- X stands for each of the numbers present in your sum.
- X bar stands for the simple moving average and will always remain unchanged.
- N stands for several periods that are present as stated earlier.
A good example to elucidate the above formula is, for example, assuming you have 3 prices – 30, 35, and 40, and your 3 periods, then your simple moving average will be 34.67.
Sum= 30+34+40=104
X bar therefore will be 104/3=34.67
Standard deviation
Insert each value by finding how much they deviate from the standard moving average as follows:
(30-34.67) ^2+ (34-34.67) ^2+ (40-34.67) ^2
21.80+0.45+44.49=66.74
We then divide this by n-1, which in this case is 3 periods minus 1, which leaves us with 2.
The result will be:
To find the final outcome, we find the square root of the result – 5.78.
The upper band can therefore be calculated as follows:
Upper band = standard moving average + (STANDARD DEVIATION*2)
LOWER BAND= SMA-(SD*2)
So, according to the above-stated formula, the upper band will be:
The result is the upper band in this case.
For the lower band, therefore,
In this case, our lower band will be 1.26.
This formula can therefore be repeated with various points, and we can finally develop a graph that can provide useful information and help in the decision-making of foreign exchange currencies.
Bollinger Band Trading Strategies
The most common approach that most analysts normally undertake is the overbought and oversold strategy, the squeeze approach, and the standard deviation of multiple Bollinger Bands. To be on the safe side, be advised that Bollinger Bands should not be used singly but rather should be complemented with other methods for complete accuracy.
The Bollinger Bounce Bands
One thing that is always possible with Bollinger Bands is the fact that the price will always tend to move to the middle of the bands. A single glance at the Bollinger chart can predict to you the prices to be expected later.
In a Bollinger chart, when the price reaches its maximum and is experiencing high bands, the price is ultimately bound to bounce downwards. This typically explains the bouncing of a Bollinger Band. This behaviour can be attributed to the fact that Bollinger Bands act as dynamic sustenance and resistance levels. If the time frame is elongated, then the bands get stronger.
Complementary systems have been developed to help work hand in hand with this band especially when the trend isn’t very clear or rather ranging.
An important precautionary note to keep in mind is that trading in the Bollinger Band: when the prices are expanding, it is not advisable to make a move since the prices are not moving in a range, rather they are moving in a trend. Investors need to be very mindful of this and as such the width of the band is very important.
The limitations of Bollinger bounce are:
- The greatest disadvantage of the Bollinger Bands forex trading strategy lies in its inability to indicate the most suitable phase in a price action trend movement to open or exit a trade or even to initiate buying or selling a currency pair. It only acts as an indicator of the trading price volatility.
- One of these limitations is that Bollinger Bands are primarily reactive, not predictive. The bands will react to changes in price movements, either uptrends or downtrends, but will not predict prices. In other words, like most technical indicators, Bollinger Bands are a lagging indicator. The default setting is not suitable for all markets. Active traders may require a smaller number of periods and a smaller number of STD deviations.
- Though Bollinger Bands can produce their predefined signals, they can be used singly. They have to be complemented with other methods to make the outcome correct.
- Another limitation of the Bollinger Band strategy is the fact that it uses past data to predict the future. If the past was suffering from a particular issue that is not present, then it is quite evident that an error would have already been made. With this, most bands are termed as reactive rather than predictive.
The Bollinger Squeeze Trading Strategy
Bollinger Bands trading strategy normally exhibits two distinct patterns that are the squeeze and the breakout. The squeeze occurs when the volatility in the market is very narrow. This may symbolize the upcoming of a big outcome. This simply means that when the bands squeeze together, the breakouts are always ready to happen. It can also be explained by the situation when the price has been moving aggressively and then eventually starts to move sideways. Consequently, when the bands expand, the market will automatically experience breakouts in the economy. This can be attributed to the huge market movements in the economy.
To determine if the asset price is consolidating, investigate the movement exhibited by the upper and lower band. If they get closer then the price is consolidating. When the price breaks through the upper band, the trader often buys but when the price breaks through the lower band, the trader sells.
Final Words
The entire article has helped in providing insight to investors who want to enter the trading world. Dealing in currency trading is quite challenging and there are a lot of things one needs to understand. You cannot just enter a forex market and expect to get away just by making a good guess.
The chances of such an investor to grow financially are very narrow since the basis of earning is very shallow. This is why it is crucial to know the trading strategy of Bollinger Bands that contains the methods one can use to be successful with forex trading and to play safely in the game without hurting one’s pocket.
Traders find that forex trading Bollinger Bands strategy has multiple uses including the application in overbought and oversold trade signals. Multiple Bands can also be used to highlight the price movement strength.
The Bollinger Band is just a tool used to arrive at the desired result. Therefore, it should be noted that it may depict some limitations which are very normal since the idea is manmade. Other complementary methods can be applied if an event’s accuracy of the work is at stake.
This post is also available in: Indonesia Português
https://www.investopedia.com.cach3.com/walkthrough/forex/intermediate/level4/bollinger-bands.aspx.htmlhttps://trade-in.forex/bollinger-bands-strategy/
