What are Bollinger Bands and how to use them in Forex Trading?
Bollinger Bands are a powerful and popular technical analysis tool utilized by Forex traders to identify potential market trends and price volatility. Developed by John Bollinger in the 1980s, Bollinger Bands consist of three lines that help traders make informed decisions by gauging price fluctuations and market volatility. This article delves into the intricacies of Bollinger Bands, explaining how they function and how Forex traders can effectively use them to make profitable trades. Additionally, we will discuss several Bollinger Band strategies that can enhance your trading experience.
Understanding Bollinger Bands
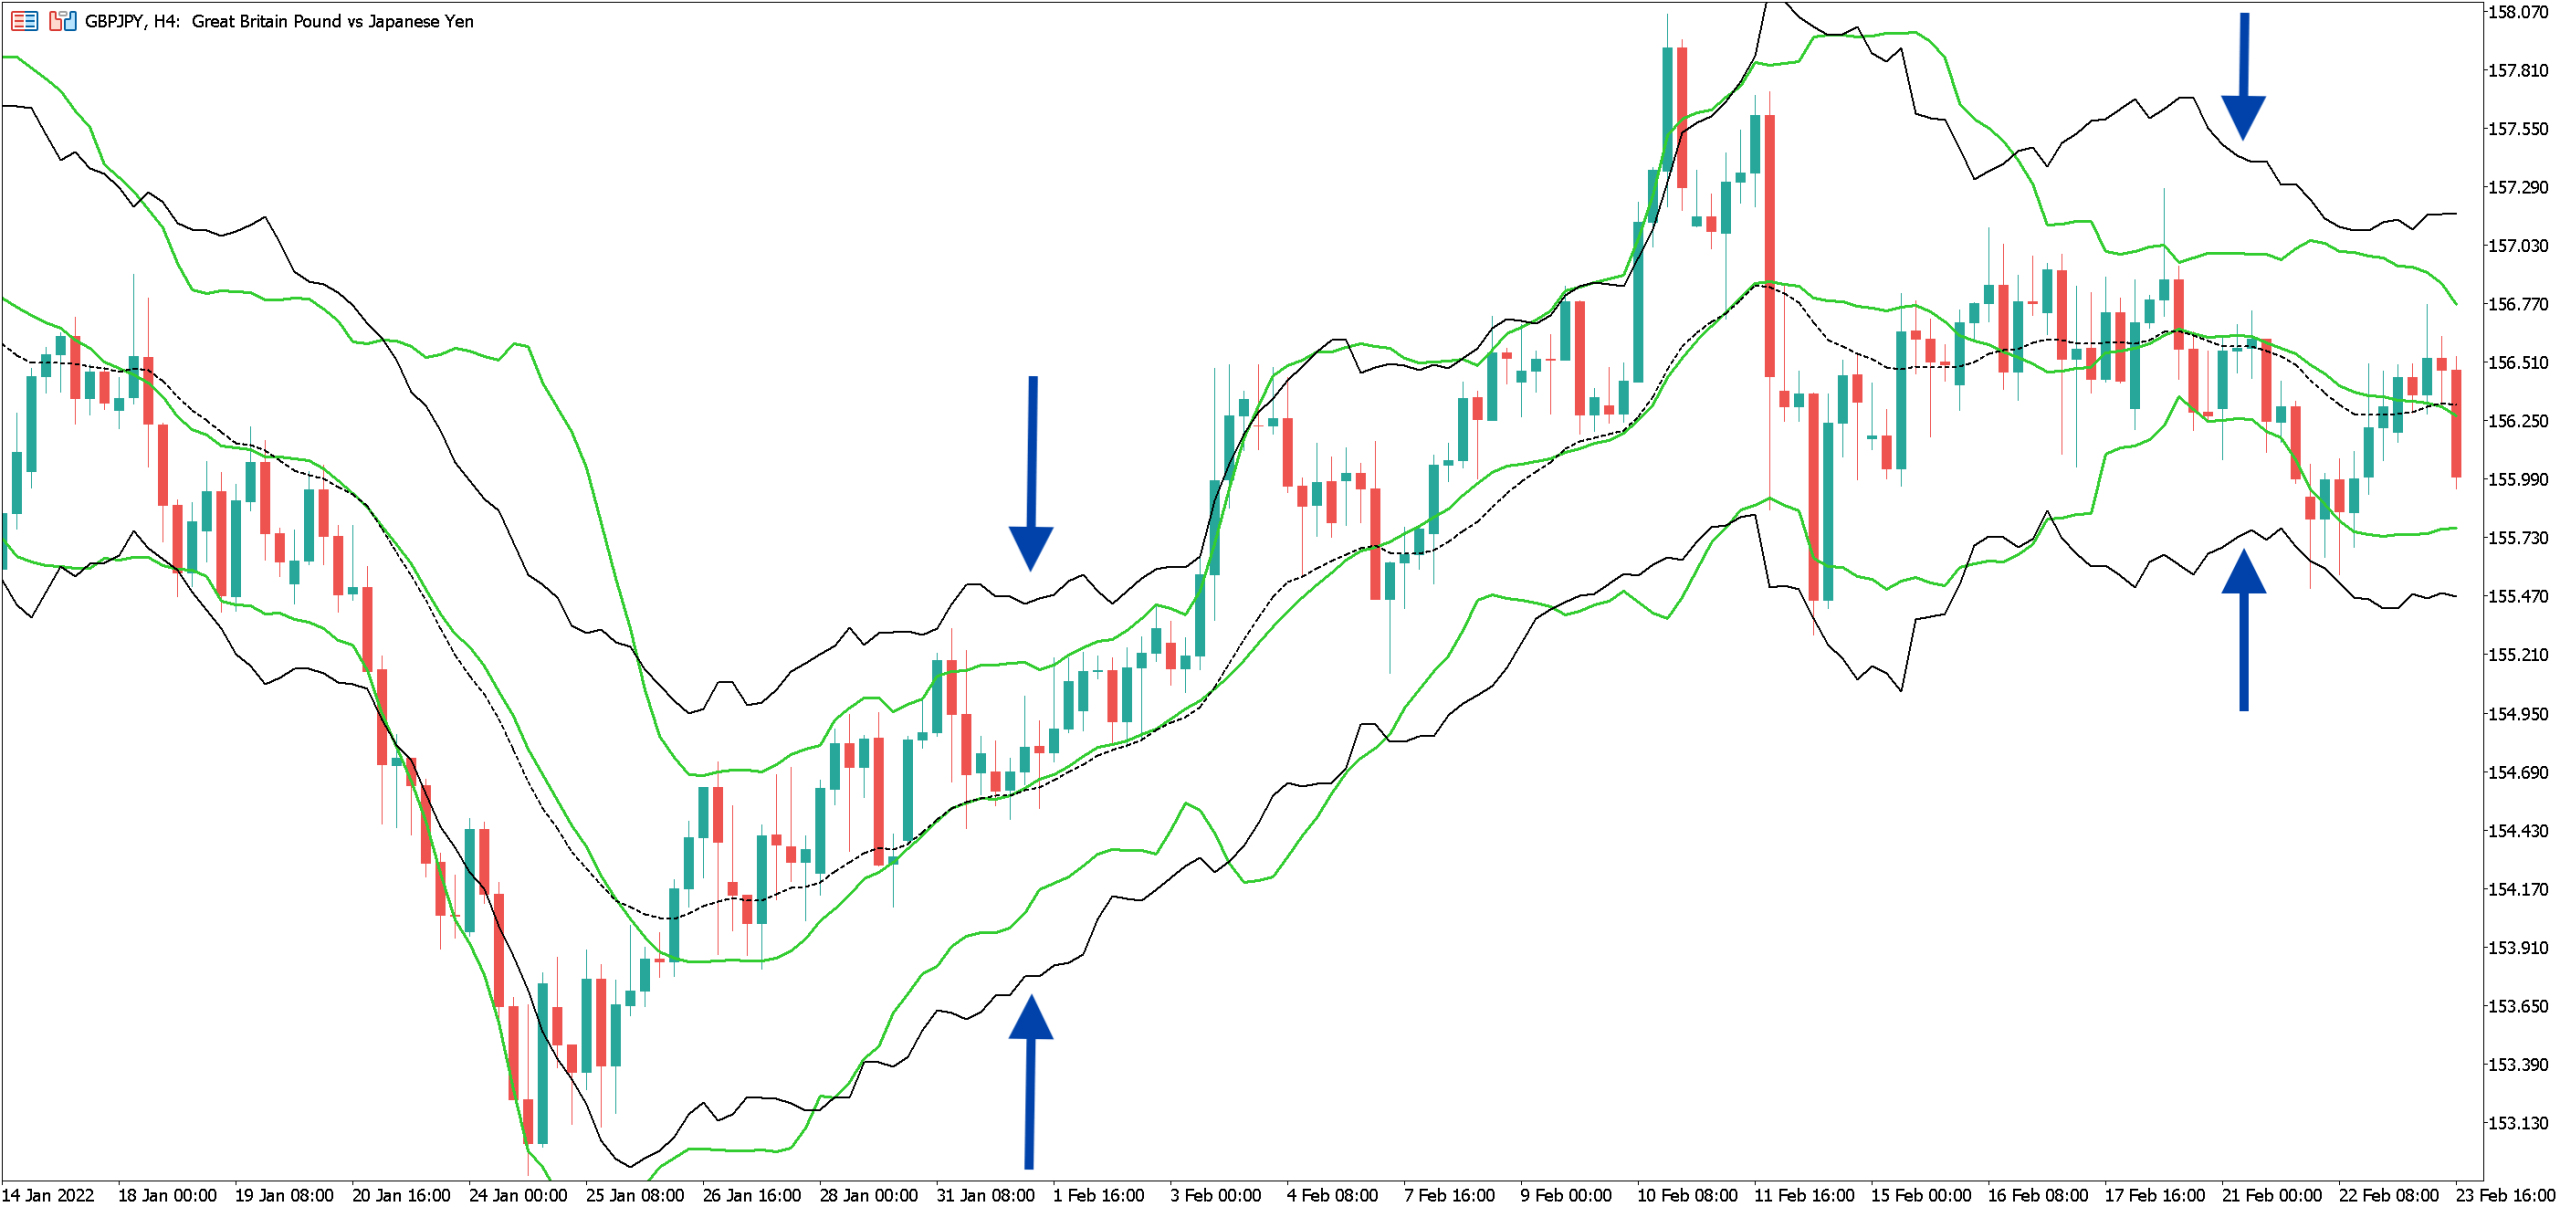
Bollinger Bands indicator comprise three lines: a simple moving average (SMA) line, an upper band, and a lower band. These three bands work together to capture price movements and volatility in the market.
- Simple Moving Average (SMA): The SMA line represents the average price of a currency pair over a specified period, usually 20 days. This line helps traders identify the general market trend.
- Upper Band: The upper band is calculated by adding twice the standard deviation of the SMA to the SMA value. This band helps traders gauge potential resistance levels in an uptrend.
- Lower Band: The lower band is calculated by subtracting twice the standard deviation of the SMA from the SMA value. This band helps traders identify potential support levels in a downtrend.
The space between the upper and lower bands is often referred to as the “Bollinger Bandwidth,” which represents the market’s volatility. When the bands contract, it indicates low volatility, and when the bands expand, it signifies high volatility.
Most of the trading platforms already have a built-in Bollinger Bands indicator that you may use on your charts, but if you are trading on Metatrader4 platform and would like an advanced version of Bollinger Bands you can download Custom Bollinger Bands MT4 indicator here.
Using Bollinger Bands in Forex Trading
Bollinger Bands indicator can provide invaluable insights for Forex traders in various ways by offering a visual representation of market dynamics. They can help traders make informed decisions by identifying potential trading opportunities and determining suitable entry and exit points. Here are a few ways you can incorporate Bollinger Bands into your trading strategy:
- Identify Overbought and Oversold Conditions: Bollinger Bands can help traders gauge the relative extremeness of a currency pair’s price by signaling overbought or oversold conditions. When the price touches or exceeds the upper band, it may suggest that the market is overextended, and a correction or reversal could be imminent. Conversely, when the price touches or dips below the lower band, it indicates that the market might be oversold, and a price increase or trend reversal could follow. By considering additional factors such as market sentiment, economic indicators, and other technical analysis tools, traders can use these signals to make better-informed trading decisions.
- Spot Breakouts: Breakouts occur when the price of a currency pair moves significantly beyond the upper or lower bands, signaling a strong trend in that direction. Bollinger Bands can help traders spot potential breakouts by monitoring the bands’ contraction and expansion. When the bands contract, it indicates a period of low volatility and potential consolidation, which could precede a breakout. Conversely, when the bands expand, it signifies increased volatility and a potential trend continuation or reversal. By combining Bollinger Bands with other technical analysis tools, such as trend lines and chart patterns, traders can more accurately identify breakouts and determine the most opportune moments to enter or exit trades.
- Determine Support and Resistance Levels: Bollinger Bands can also help traders identify potential support and resistance levels. In an uptrend, the upper band may act as a resistance level, where the price struggles to rise further, while in a downtrend, the lower band can serve as a support level, where the price finds it difficult to fall below. By observing how the price interacts with the Bollinger Bands, traders can determine key price levels where the market is likely to reverse or consolidate, allowing them to adjust their trading strategies accordingly.
In addition to these core uses, Bollinger Bands can be combined with other technical analysis tools and indicators to create a more comprehensive trading strategy. For instance, traders can use moving averages, oscillators, or chart patterns alongside Bollinger Bands to confirm signals and strengthen their analysis. This multifaceted approach can help Forex traders make more informed decisions and improve their overall trading performance.
Bollinger Bands Strategies
Several Bollinger Band strategies can enhance your Forex trading experience. Some of the most popular strategies include:
- Bollinger Band Squeeze: The Bollinger Band Squeeze strategy is based on the contraction of the bands. When the bands contract, it indicates low volatility and a potential breakout. Traders should wait for the bands to expand and the price to move beyond the upper or lower band before entering a trade in the direction of the breakout.
- Bollinger Bounce: The Bollinger Bounce strategy is based on the concept that the price will likely return to the SMA line after reaching the upper or lower bands. Traders can enter a long position when the price bounces off the lower band and heads back toward the SMA or enter a short position when the price bounces off the upper band and moves back toward the SMA.
- Double Bollinger Bands: The Double Bollinger Bands strategy utilizes two sets of Bollinger Bands with different standard deviation settings. Typically, one set has a standard deviation of 1, while the other has a standard deviation of 2. This strategy provides traders with additional information about the market’s strength and direction. When the price is between the first standard deviation bands, it indicates a consolidating market. If the price moves beyond the second standard deviation bands, it suggests a strong trend in that direction. Traders can enter positions in the direction of the trend when the price moves beyond the second standard deviation bands.
- Bollinger Bands with RSI: The Bollinger Bands with RSI (Relative Strength Index) strategy combines the insights from Bollinger Bands with the RSI indicator to enhance trading decisions. The RSI can help confirm overbought or oversold conditions in conjunction with the upper and lower bands. For example, traders can look for a long position when the price touches the lower Bollinger Band and the RSI indicates oversold conditions or a short position when the price touches the upper Bollinger Band, and the RSI shows overbought conditions.
- Bollinger Bands with MACD: The Bollinger Bands with MACD (Moving Average Convergence Divergence) strategy combines the Bollinger Bands with the MACD indicator to identify potential trend reversals and trade entry points. When the MACD indicates a potential reversal in the market, traders can use the Bollinger Bands to find an optimal entry point. For instance, a bullish reversal signal from the MACD combined with the price bouncing off the lower Bollinger Band can be a good entry point for a long position. Conversely, a bearish reversal signal from the MACD along with the price bouncing off the upper Bollinger Band can be an ideal entry point for a short position.
Conclusion
Bollinger Bands are an incredibly versatile technical analysis tool that can help Forex traders make informed decisions by gauging price movements and market volatility. By understanding how Bollinger Bands work and incorporating various strategies, such as the Bollinger Band Squeeze, Bollinger Bounce, Double Bollinger Bands, and Bollinger Bands combined with RSI or MACD, traders can enhance their trading experience and increase their chances of success in the Forex market.
Remember, no single technical analysis tool or strategy guarantees success. It’s crucial to incorporate Bollinger Bands into a well-rounded trading plan that includes risk management and a thorough understanding of market fundamentals. As you gain experience and confidence in using Bollinger Bands, you’ll be able to refine your strategies and adapt them to suit your trading style and the ever-changing Forex market.
Share this:
- Click to share on X (Opens in new window) X
- Click to share on Facebook (Opens in new window) Facebook
- Click to share on Pinterest (Opens in new window) Pinterest
- Click to share on WhatsApp (Opens in new window) WhatsApp
- Click to email a link to a friend (Opens in new window) Email
An Introduction to Bollinger Bands in Forex Trading

Bollinger Bands are a popular and widely used technical analysis tool in the world of forex trading. Developed by John Bollinger in the early 1980s, Bollinger Bands are a versatile indicator that can help traders identify potential trend reversals, volatility, and overbought or oversold conditions. In this article, we will delve into the concept of Bollinger Bands, how they are calculated, and how they can be effectively used in forex trading.

Bollinger Bands consist of three lines – an upper band, a middle band, and a lower band. The middle band is a simple moving average (SMA), usually set at 20 periods. The upper and lower bands are calculated by adding and subtracting a certain number of standard deviations from the middle band. The standard deviation is a measure of volatility, and the number of standard deviations used can be adjusted to suit the trader’s preferences.
The most common setting for Bollinger Bands is to use two standard deviations, which means that approximately 95% of price action will fall within the bands. However, traders can experiment with different settings to suit their trading style and the currency pair being traded. A larger number of standard deviations will widen the bands, while a smaller number will narrow them.
The upper band represents the overbought zone, while the lower band represents the oversold zone. When the price touches or crosses the upper band, it indicates that the market is overbought, and there is a higher probability of a downward price movement. Conversely, when the price touches or crosses the lower band, it suggests that the market is oversold, and there is a higher probability of an upward price movement.
One of the most significant advantages of using Bollinger Bands is their ability to identify periods of low volatility and high volatility. When the bands are narrow, it suggests that the market is experiencing low volatility, and a significant price movement may be imminent. Conversely, when the bands are wide, it indicates high volatility, and the market may be entering a period of consolidation or ranging.
Traders can also use Bollinger Bands to identify potential trend reversals. When the price is trending upwards and starts touching or crossing the upper band, it may indicate that the trend is losing momentum, and a reversal could be on the horizon. Similarly, when the price is trending downwards and starts touching or crossing the lower band, it may indicate a potential trend reversal to the upside.
In addition to the basic interpretation of Bollinger Bands, traders often use additional indicators or patterns to confirm signals generated by the bands. For example, a trader may look for candlestick patterns or other technical indicators to validate a potential reversal when the price touches or crosses the upper or lower band.
It is important to note that Bollinger Bands should not be used in isolation. Like any other technical analysis tool, they are best used in conjunction with other indicators and analysis techniques to increase the probability of successful trades. Traders should also be aware that Bollinger Bands are not foolproof and can generate false signals, especially during periods of low volatility or ranging markets.
In conclusion, Bollinger Bands are a powerful tool in forex trading that can help traders identify potential trend reversals, overbought or oversold conditions, and periods of low or high volatility. By understanding how Bollinger Bands are calculated and how to interpret their signals, traders can enhance their decision-making process and improve their overall trading performance. However, it is essential to use Bollinger Bands in conjunction with other indicators and analysis techniques to validate signals and minimize the risk of false signals.
https://dadforex.com/advice/what-are-bollinger-bands-and-how-to-use-them-in-forex-trading/https://www.forex.academy/an-introduction-to-bollinger-bands-in-forex-trading/
