3 Reasons to Buy Visa Stock Like There’s No Tomorrow
The company is embracing AI initiatives, including a platform that would allow AI agents to make purchases.
NYSE: V
Visa
Market Cap
Today’s Change
Arrow-Thin-Down
Current Price
Price as of August 1, 2025, 3:58 p.m. ET
The financial services company reports earnings on July 29. Here’s why its stock is worth buying now and holding for the long term.
If you’re looking for a combination of performance and security, there are few stocks in the market today that could top Visa (V -1.96% ) . The credit card company offers a payments network that connects banks, merchants, and consumers — and gets a cut of the payment every time someone swipes their card.
Visa is set to report its earnings for the third fiscal quarter of 2025 on July 29 — and all signs point to another solid report that should push Visa stock higher. Here are three reasons why you should be considering Visa on your shopping list to augment your investment portfolio.
Visa is an earnings stalwart
Visa is already coming off a strong second quarter (ending March 31, 2025) in which it processed 60.7 billion individual transactions, up 9% from the previous year. Revenue was $9.6 billion, up 9%, and non-GAAP (adjusted) earnings came in at $5.4 billion and $2.76 per share, up 6% and 10%, respectively, from a year ago.
“Consumer spending remained resilient, even with macroeconomic uncertainty,” CEO Ryan McInerney said in the Q2 earnings release. “Our strategy across consumer payments, commercial and money movement solutions and value-added services, our diversified business model, and our focus on innovation position us well for the rest of the fiscal year and beyond.”
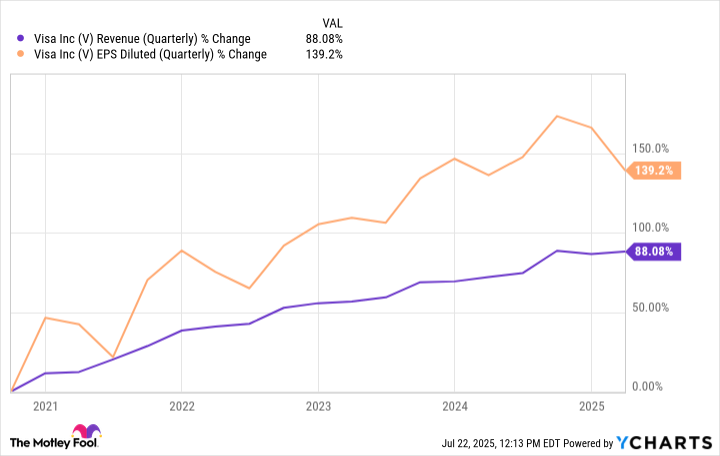
Visa is seeing strong, consistent revenue growth, which is up 88% over the last five years. Earnings-per-share (EPS), meanwhile, is up 139%.
Visa also repurchased $4.5 billion in shares in the second quarter and had another $4.7 billion available for additional authorized share repurchases. The company reiterated its guidance for full-year revenue growth to be in the low upper digits, and EPS growth to be in the high end of low double digits.
With no spending slowdown, even though the market is facing a few challenges with inflation and tariff concerns, Visa appears set to deliver another strong quarter when it reports earnings on July 29.
The company is embracing artificial intelligence
It seems as if artificial intelligence (AI) is everywhere, and forward-looking companies are looking for new ways to incorporate the technology into their products. That’s why Visa rolled out its Visa Intelligent Commerce platform earlier this year that will allow people to use AI agents to find and buy products for them. The platform would include tokenized digital credentials that would replace physical cards, AI-powered personalization of spending and purchasing insights, and AI payments through Visa’s network.
Visa says it’s working with several AI companies on the efforts, including Anthropic, International Business Machines, Microsoft, Mistal AI, OpenAI, Perplexity, Samsung, and Stripe.
Visa also has announced a new version of its Authorize.net web platform, which allows merchants to accept credit cards and electronic check payments online or over the phone. The platform includes a new user interface and AI capabilities with an AI agent, and dashboards that will help businesses analyze data and summarize insights.
Also, late last year Visa completed its acquisition of Featurespace, which is an AI-native transaction monitoring company that helps prevent financial crimes and fraud. The acquisition is designed to give businesses in the Visa network access to improved fraud detection services, including real-time detection of fraud attacks.
As AI continues to grow, both Visa’s business clients and cardholders will rely more on AI for everyday tasks. While I think it’s a little scary to turn my spending over to AI, in a few years it may be commonly done — and it’s important for companies like Visa to remain on the forefront of innovation.

Image source: Getty Images.
Visa is a stock that pays you back
In addition to its robust stock repurchasing plan, Visa is also a solid dividend stock. That’s important for income investors who are looking to either use Visa’s quarterly payouts for living expenses or to reinvest into their portfolio. Visa has raised its dividend for 17 consecutive years and currently offers a dividend yield of 2.3%.
In addition, Visa’s payout ratio is a minuscule 18.5%, which means this is one of the safer dividends that you can find. The payout is one of the reasons, I’m sure, that Visa has been a staple in Warren Buffett’s Berkshire Hathaway portfolio since 2011.
In any economy, Visa can be seen as a safe-haven type of stock. When credit card balances increase and people are more likely to swipe or tap their cards, Visa gets more profit. And because Visa isn’t in the business of lending money, like American Express, it doesn’t have to worry about anyone defaulting on their loans.
The bottom line
Visa will never be confused for a sexy, exciting growth stock with huge upside and dynamic innovation. But that’s fine. It’s a solid, respectable stock that can serve to be an anchor in any portfolio. That’s why I think it’s worth buying now and will continue to be a buy after its earnings report.
About the Author
Patrick Sanders is a contributing Motley Fool Stock Market Analyst covering publicly traded companies and exchange-traded funds in the consumer,financial, and technology sectors. Prior to The Motley Fool, Patrick was Assistant Managing Editor for U.S. News & World Report’s Investing advice section and founder of their daily stock market newsletter, “Invested.” He previously was Deputy Managing Editor of InvestorPlace.com. He was also a Managing Editor for news websites in southeast Europe and Turkey, was founding Managing Editor for The New York Times Editing Center, and was Connecticut News Editor for The Associated Press. Patrick has made numerous media appearances as a stock market analyst and appeared on panels to discuss personal finance and investing. He holds a B.A. in Journalism from Marshall University.
American Express is an advertising partner of Motley Fool Money. Patrick Sanders has no position in any of the stocks mentioned. The Motley Fool has positions in and recommends Berkshire Hathaway, International Business Machines, Microsoft, and Visa. The Motley Fool recommends the following options: long January 2026 $395 calls on Microsoft and short January 2026 $405 calls on Microsoft. The Motley Fool has a disclosure policy.
Financial Ratios
A free best practices guide for essential ratios in comprehensive financial analysis and business decision-making.
Written by CFI Team
Read Time 4 minutes
What are Financial Ratios?
Financial ratios are created with the use of numerical values taken from financial statements to gain meaningful information about a company. The numbers found on a company’s financial statements – balance sheet, income statement, and cash flow statement – are used to perform quantitative analysis and assess a company’s liquidity, leverage, growth, margins, profitability, rates of return, valuation, and more.

Financial ratios are grouped into the following categories:
- Liquidity ratios
- Leverage ratios
- Efficiency ratios
- Profitability ratios
- Market value ratios
Uses and Users of Financial Ratio Analysis
Analysis of financial ratios serves two main purposes:
1. Track company performance
Determining individual financial ratios per period and tracking the change in their values over time is done to spot trends that may be developing in a company. For example, an increasing debt-to-asset ratio may indicate that a company is overburdened with debt and may eventually be facing default risk.
2. Make comparative judgments regarding company performance
Comparing financial ratios with that of major competitors is done to identify whether a company is performing better or worse than the industry average. For example, comparing the return on assets between companies helps an analyst or investor to determine which company is making the most efficient use of its assets.
Users of financial ratios include parties external and internal to the company:
- External users: Financial analysts, retail investors, creditors, competitors, tax authorities, regulatory authorities, and industry observers
- Internal users: Management team, employees, and owners
Liquidity Ratios
Liquidity ratios are financial ratios that measure a company’s ability to repay both short- and long-term obligations. Common liquidity ratios include the following:
The current ratio measures a company’s ability to pay off short-term liabilities with current assets:
Current ratio = Current assets / Current liabilities
The acid-test ratio measures a company’s ability to pay off short-term liabilities with quick assets:
Acid-test ratio = Current assets – Inventories / Current liabilities
The cash ratio measures a company’s ability to pay off short-term liabilities with cash and cash equivalents:
Cash ratio = Cash and Cash equivalents / Current Liabilities
The operating cash flow ratio is a measure of the number of times a company can pay off current liabilities with the cash generated in a given period:
Operating cash flow ratio = Operating cash flow / Current liabilities
Leverage Financial Ratios
Leverage ratios measure the amount of capital that comes from debt. In other words, leverage financial ratios are used to evaluate a company’s debt levels. Common leverage ratios include the following:
The debt ratio measures the relative amount of a company’s assets that are provided from debt:
Debt ratio = Total liabilities / Total assets
The debt to equity ratio calculates the weight of total debt and financial liabilities against shareholders’ equity:
Debt to equity ratio = Total liabilities / Shareholder’s equity
The interest coverage ratio shows how easily a company can pay its interest expenses:
Interest coverage ratio = Operating income / Interest expenses
The debt service coverage ratio reveals how easily a company can pay its debt obligations:
Debt service coverage ratio = Operating income / Total debt service
Efficiency Ratios
Efficiency ratios, also known as activity financial ratios, are used to measure how well a company is utilizing its assets and resources. Common efficiency ratios include:
The asset turnover ratio measures a company’s ability to generate sales from assets:
Asset turnover ratio = Net sales / Average total assets
The inventory turnover ratio measures how many times a company’s inventory is sold and replaced over a given period:
Inventory turnover ratio = Cost of goods sold / Average inventory
The accounts receivable turnover ratio measures how many times a company can turn receivables into cash over a given period:
Receivables turnover ratio = Net credit sales / Average accounts receivable
The days sales in inventory ratio measures the average number of days that a company holds on to inventory before selling it to customers:
Days sales in inventory ratio = 365 days / Inventory turnover ratio
Profitability Ratios
Profitability ratios measure a company’s ability to generate income relative to revenue, balance sheet assets, operating costs, and equity. Common profitability financial ratios include the following:
The gross margin ratio compares the gross profit of a company to its net sales to show how much profit a company makes after paying its cost of goods sold:
Gross margin ratio = Gross profit / Net sales
The operating margin ratio, sometimes known as the return on sales ratio, compares the operating income of a company to its net sales to determine operating efficiency:
Operating margin ratio = Operating income / Net sales
The return on assets ratio measures how efficiently a company is using its assets to generate profit:
Return on assets ratio = Net income / Total assets
The return on equity ratio measures how efficiently a company is using its equity to generate profit:
Return on equity ratio = Net income / Shareholder’s equity
Learn more about the different profitability ratios in the following video:
Market Value Ratios
Market value ratios are used to evaluate the share price of a company’s stock. Common market value ratios include the following:
The book value per share ratio calculates the per-share value of a company based on the equity available to shareholders:
Book value per share ratio = (Shareholder’s equity – Preferred equity) / Total common shares outstanding
The dividend yield ratio measures the amount of dividends attributed to shareholders relative to the market value per share:
Dividend yield ratio = Dividend per share / Share price
The earnings per share ratio measures the amount of net income earned for each share outstanding:
Earnings per share ratio = Net earnings / Total shares outstanding
The price-earnings ratio compares a company’s share price to its earnings per share:
Price-earnings ratio = Share price / Earnings per share
Related Readings
Thank you for reading CFI’s guide to financial ratios. To help you advance your career in the financial services industry, check out the following additional CFI resources:
- Activity Ratios
- Comparable Company Analysis
- Enterprise Value-to-Sales (EV/Sales)
- Solvency Ratio
- Types of Financial Models
- See all accounting resources
- See all capital markets resources
Additional Resources
CFI is a global provider of financial modeling courses and of the FMVA Certification. CFI’s mission is to help all professionals improve their technical skills. If you are a student or looking for a career change, the CFI website has many free resources to help you jumpstart your Career in Finance. If you are seeking to improve your technical skills, check out some of our most popular courses. Below are some additional resources for you to further explore:
- Careers
- CFI’s Most Popular Courses
- All CFI Resources
- Finance Terms
The Financial Modeling Certification
Analyst Certification FMVA® Program
CFI is a global provider of financial modeling courses and of the FMVA Certification. CFI’s mission is to help all professionals improve their technical skills. If you are a student or looking for a career change, the CFI website has many free resources to help you jumpstart your Career in Finance. If you are seeking to improve your technical skills, check out some of our most popular courses. Below are some additional resources for you to further explore:
- Careers
- CFI’s Most Popular Courses
- All CFI Resources
- Finance Terms
The Financial Modeling Certification
Below is a break down of subject weightings in the FMVA® financial analyst program. As you can see there is a heavy focus on financial modeling, finance, Excel, business valuation, budgeting/forecasting, PowerPoint presentations, accounting and business strategy.

A well rounded financial analyst possesses all of the above skills!
Additional Questions & Answers
CFI is the global institution behind the financial modeling and valuation analyst FMVA® Designation. CFI is on a mission to enable anyone to be a great financial analyst and have a great career path. In order to help you advance your career, CFI has compiled many resources to assist you along the path.
In order to become a great financial analyst, here are some more questions and answers for you to discover:
- What is Financial Modeling?
- How Do You Build a DCF Model?
- What is Sensitivity Analysis?
- How Do You Value a Business?
Get Certified for Financial Modeling (FMVA)®
Gain in-demand industry knowledge and hands-on practice that will help you stand out from the competition and become a world-class financial analyst.
https://www.fool.com/investing/2025/07/25/3-reasons-to-buy-visa-stock-like-theres-no-tomorro/https://corporatefinanceinstitute.com/resources/accounting/financial-ratios/