10 trading indicators every trader should know
Using trading indicators is part of any technical trader’s strategy. Paired with the right risk management tools, it could help you gain more insight into price trends. Let’s explore 10 of the best trading indicators.
Trading indicators explained
Whether you’re interested in forex trading, commodities trading or share trading, it can be helpful to use technical analysis as part of your strategy – and this includes studying various trading indicators. Trading indicators are mathematical calculations, which are plotted as lines on a price chart and can help traders identify certain signals and trends within the market.
There are different types of trading indicator, including leading indicators and lagging indicators. A leading indicator is a forecast signal that predicts future price movements, while a lagging indicator looks at past trends and indicates momentum.
Best trading indicators
- Moving average (MA)
- Exponential moving average (EMA)
- Stochastic oscillator
- Moving average convergence divergence (MACD)
- Bollinger bands
- Relative strength index (RSI)
- Fibonacci retracement
- Ichimoku cloud
- Standard deviation
- Average directional index
You can use your knowledge and risk appetite as a measure to decide which of these trading indicators best suit your strategy. Note that the indicators listed here are not ranked, but they are some of the most popular choices for retail traders.
Moving average (MA)
The MA – or ‘simple moving average’ (SMA) – is an indicator used to identify the direction of a current price trend, without the interference of shorter-term price spikes. The MA indicator combines price points of a financial instrument over a specified time frame and divides it by the number of data points to present a single trend line.
The data used depends on the length of the MA. For example, a 200-day MA requires 200 days of data. By using the MA indicator, you can study levels of support and resistance and see previous price action (the history of the market). This means you can also determine possible future patterns.
Source: IG charts
Source: IG charts
Exponential moving average (EMA)
EMA is another form of moving average. Unlike the SMA, it places a greater weight on recent data points, making data more responsive to new information. When used with other indicators, EMAs can help traders confirm significant market moves and gauge their legitimacy.
The most popular exponential moving averages are 12- and 26-day EMAs for short-term averages, whereas the 50- and 200-day EMAs are used as long-term trend indicators.
Source: IG charts
Source: IG charts
Stochastic oscillator
A stochastic oscillator is an indicator that compares a specific closing price of an asset to a range of its prices over time – showing momentum and trend strength. It uses a scale of 0 to 100. A reading below 20 generally represents an oversold market and a reading above 80 an overbought market. However, if a strong trend is present, a correction or rally will not necessarily ensue.
Source: IG charts
Source: IG charts
Moving average convergence divergence (MACD)
MACD is an indicator that detects changes in momentum by comparing two moving averages. It can help traders identify possible buy and sell opportunities around support and resistance levels.
‘Convergence’ means that two moving averages are coming together, while ‘divergence’ means that they’re moving away from each other. If moving averages are converging, it means momentum is decreasing, whereas if the moving averages are diverging, momentum is increasing.
Source: IG charts
Source: IG charts
Bollinger bands
A Bollinger band is an indicator that provides a range within which the price of an asset typically trades. The width of the band increases and decreases to reflect recent volatility. The closer the bands are to each other – or the ‘narrower’ they are – the lower the perceived volatility of the financial instrument. The wider the bands, the higher the perceived volatility.
Bollinger bands are useful for recognising when an asset is trading outside of its usual levels, and are used mostly as a method to predict long-term price movements. When a price continually moves outside the upper parameters of the band, it could be overbought, and when it moves below the lower band, it could be oversold.
Source: IG charts
Source: IG charts
Relative strength index (RSI)
RSI is mostly used to help traders identify momentum, market conditions and warning signals for dangerous price movements. RSI is expressed as a figure between 0 and 100. An asset around the 70 level is often considered overbought, while an asset at or near 30 is often considered oversold.
An overbought signal suggests that short-term gains may be reaching a point of maturity and assets may be in for a price correction. In contrast, an oversold signal could mean that short-term declines are reaching maturity and assets may be in for a rally.
Source: IG charts
Source: IG charts
Fibonacci retracement
Fibonacci retracement is an indicator that can pinpoint the degree to which a market will move against its current trend. A retracement is when the market experiences a temporary dip – it is also known as a pullback.
Traders who think the market is about to make a move often use Fibonacci retracement to confirm this. This is because it helps to identify possible levels of support and resistance, which could indicate an upward or downward trend. Because traders can identify levels of support and resistance with this indicator, it can help them decide where to apply stops and limits, or when to open and close their positions.
Source: IG charts
Source: IG charts
Ichimoku cloud
The Ichimoku Cloud, like many other technical indicators, identifies support and resistance levels. However, it also estimates price momentum and provides traders with signals to help them with their decision-making. The translation of ‘Ichimoku’ is ‘one-look equilibrium chart’ – which is exactly why this indicator is used by traders who need a lot of information from one chart.
In a nutshell, it identifies market trends, showing current support and resistance levels, and also forecasting future levels.
Source: IG charts
Standard deviation
Standard deviation is an indicator that helps traders measure the size of price moves. Consequently, they can identify how likely volatility is to affect the price in the future. It cannot predict whether the price will go up or down, only that it will be affected by volatility.
Standard deviation compares current price movements to historical price movements. Many traders believe that big price moves follow small price moves, and small price moves follow big price moves.
Source: IG charts
Source: IG charts
Average directional index (ADX)
The ADX illustrates the strength of a price trend. It works on a scale of 0 to 100, where a reading of more than 25 is considered a strong trend, and a number below 25 is considered a drift. Traders can use this information to gather whether an upward or downward trend is likely to continue.
ADX is normally based on a moving average of the price range over 14 days, depending on the frequency that traders prefer. Note that ADX never shows how a price trend might develop, it simply indicates the strength of the trend. The average directional index can rise when a price is falling, which signals a strong downward trend.
Source: IG charts
Source: IG charts
What you need to know before using trading indicators
The first rule of using trading indicators is that you should never use an indicator in isolation or use too many indicators at once. Focus on a few that you think are best suited to what you’re trying to achieve. You should also use technical indicators alongside your own assessment of the movements of an asset’s price over time (the ‘price action’).
It’s important to remember that you have to confirm a signal in some way. If you’re getting a ‘buy’ signal from an indicator and a ‘sell’ signal from the price action, you need to use different indicators, or different time frames until your signals are confirmed.
Another thing to keep in mind is that you must never lose sight of your trading plan. Your rules for trading should always be implemented when using indicators.
To practise using trading indicators, try IG’s demo account.
Or, if you’re ready to start trading, open a live account.
This information has been prepared by IG, a trading name of IG Markets Limited. In addition to the disclaimer below, the material on this page does not contain a record of our trading prices, or an offer of, or solicitation for, a transaction in any financial instrument. IG accepts no responsibility for any use that may be made of these comments and for any consequences that result. No representation or warranty is given as to the accuracy or completeness of this information. Consequently any person acting on it does so entirely at their own risk. Any research provided does not have regard to the specific investment objectives, financial situation and needs of any specific person who may receive it. It has not been prepared in accordance with legal requirements designed to promote the independence of investment research and as such is considered to be a marketing communication. Although we are not specifically constrained from dealing ahead of our recommendations we do not seek to take advantage of them before they are provided to our clients.
Explore the markets with our free course
Discover the range of markets and learn how they work – with IG Academy’s online course.
IG Analyst Publication date : 2019-08-06T07:58:50+0100
IG Analyst Publication date : 2019-11-20T12:05:18+0000
IG Analyst Publication date : 2019-11-19T12:40:01+0000
IG Analyst Publication date : 2019-05-20T14:51:44+0100
Angeline Ong, Publication date : 2023-10-12T07:52:38+0100
You might be interested in…
How much does trading cost?
Find out about IG
Plan your trading
Find out what charges your trades could incur with our transparent fee structure.
Discover why so many clients choose us, and what makes us a world-leading provider of CFDs.
Stay on top of upcoming market-moving events with our customisable economic calendar.
Markets
Trading platforms
Learn to trade
About
Contact us

WhatsApp: Click here to chat to us on our official WhatsApp channel, 10am to 7pm (UTC+10), Monday to Friday
Follow us online:
^IG International Limited is part of the IG Group and its ultimate parent company is IG Group Holdings Plc. IG Group established in London in 1974, and is a constituent of the FTSE 250 index.
The risks of loss from investing in CFDs can be substantial and the value of your investments may fluctuate. 71% of retail client accounts lose money when trading CFDs, with this investment provider. CFDs are complex instruments and come with a high risk of losing money rapidly due to leverage. You should consider whether you understand how this product works, and whether you can afford to take the high risk of losing your money.
CFD Accounts provided by IG International Limited. IG International Limited is licensed to conduct investment business and digital asset business by the Bermuda Monetary Authority.
IG provides an execution-only service. The information in this site does not contain (and should not be construed as containing) investment advice or an investment recommendation, or an offer of or solicitation for transaction in any financial instrument. IG accepts no responsibility for any use that may be made of these comments and for any consequences that result.
The information on this site is not directed at residents of the United States and is not intended for distribution to, or use by, any person in any country or jurisdiction where such distribution or use would be contrary to local law or regulation.
IG International Limited is part of the IG Group and its ultimate parent company is IG Group Holdings Plc. IG International Limited receives services from other members of the IG Group including IG Markets Limited.
What are-most common market indicators forex traders follow trading strategies
Read Time: 8 minutes
“I used fundamentals for nine years and got rich as a technician”
– Martin S. Schwartz
(author of Pit Bull: Lessons from Wall Street’s Champion Day Trader).
Are you leveraging the power of forex indicators in your trading strategy? Indicators play a vital role in identifying trends, assessing price momentum, and pinpointing potential entry and exit points.
Whilst no single indicator guarantees success, understanding how to properly use a blend of them can greatly improve your trading decisions. However, used incorrectly, they can be devastating to a traders’ performance.
This blog post covers some of the most widely-used forex indicators and how each of them can enhance your forex trading strategy; Moving Averages (MAs), RSI, Bollinger Bands, MACD, and Fibonacci retracements and extensions.
Table of Contents
- Introduction
- Moving Averages
- Using MAs for Trend Analysis
- Using MAs for Support & Resistance
Moving Averages
Moving Averages (MAs) are used to identify trends and smooth out price action. Two common types include:
Simple Moving Average (SMA): Average prices over a specified period, giving equal weight to each data point.
Exponential Moving Average (EMA): Gives more weight to recent prices, making it more responsive to price changes.
Moving averages trading helps determine overall trend direction, but can also be used as support and resistance.
Using MAs for Trend Analysis
The 50-day and 100-day simple moving averages are widely used by traders around the world. As a rule of thumb, the wide the delta between two moving averages, the stronger the trend, as shown in Figure 1 below.
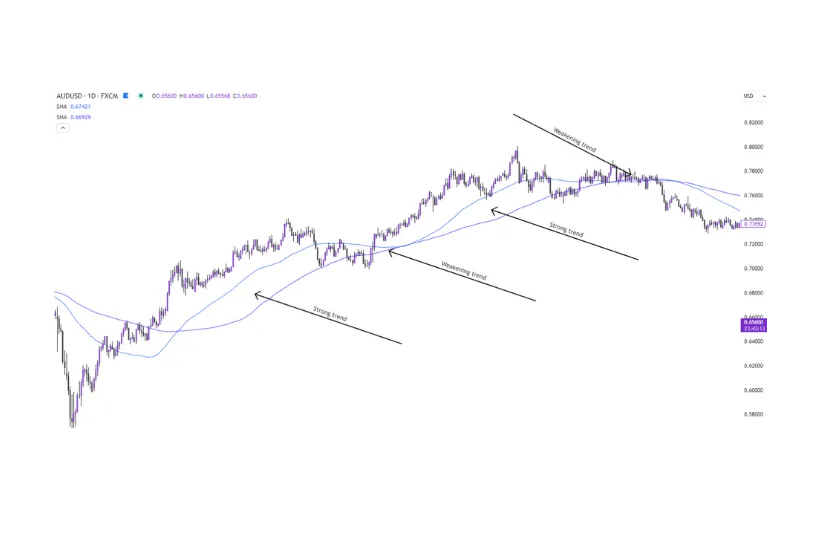
Figure 1 – Examples of a strong and weakening trend using the 50sma and 100sma.
Another commonly-used moving average is the 200-day SMA. When combined with the 50-day moving average, traders keep a close eye out for a ‘Golden Cross’, or ‘Death Cross’, when the 50sma crosses above, or below the 200sma. This pattern has a history of identifying a possible reversal after a strong trend.
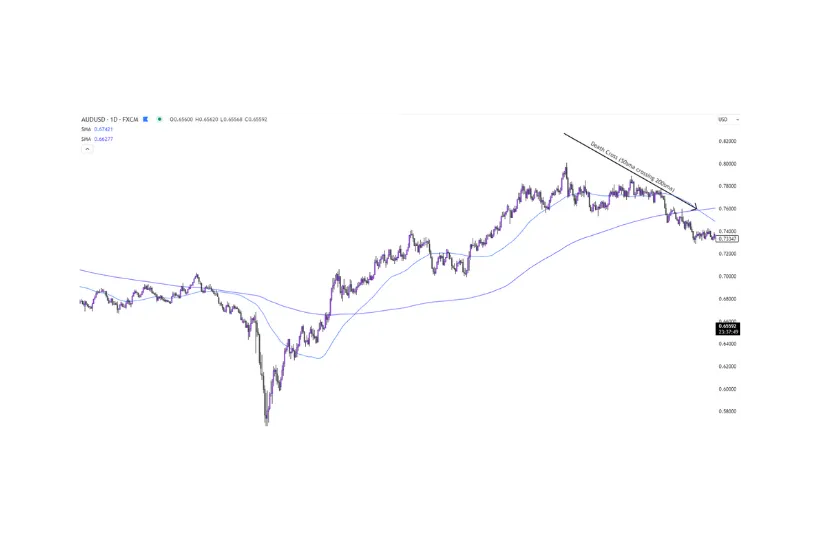
Figure 2a – example of a ‘Death Cross’ on the AUDUSD daily chart.
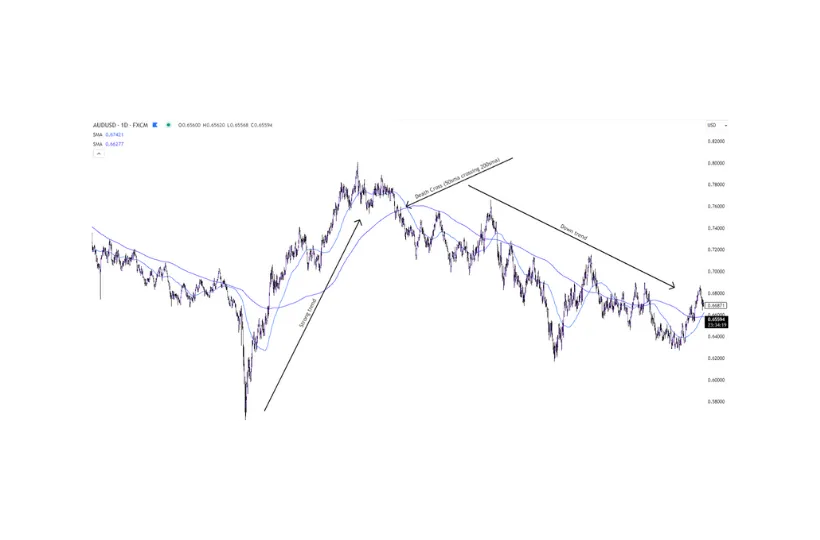
Figure 2b – the resulting change in trend direction.
Using MAs for Support & Resistance
Some traders use MAs as support and resistance levels for entering, and exiting trades. This method works on all timeframes but is most commonly used for intraday trading. For example, Figure 3 highlights a number of support and resistance points using the 50, 100, and 200 SMA’s on the 15min chart of EURUSD;
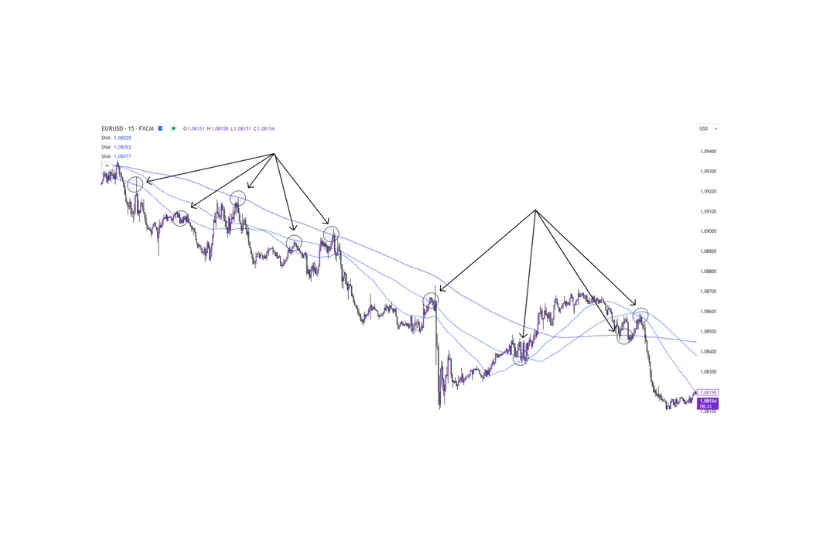
Figure 3 – Support and resistance using 50, 100, & 200sma on a 15min EURUSD chart.
Relative Strength Index (RSI)
The Relative Strength Index (RSI) is a momentum oscillator that measures the speed and change of price movements. It ranges from 0 to 100, providing insight into whether an asset is overbought or oversold.
Using RSI to identify overbought and oversold extremities:
- Overbought (70+): Indicates that an asset may be overvalued and could be vulnerable to a pullback.
- Oversold (30 or below): Suggests that an asset may be undervalued, potentially leading to a price rebound.
Additionally, divergence occurs when the price and RSI move in opposite directions, signalling a potential reversal. For example, if the price makes a new high but the RSI does not, this “bearish divergence” may suggest a decline, as shown in Figure 4 below.
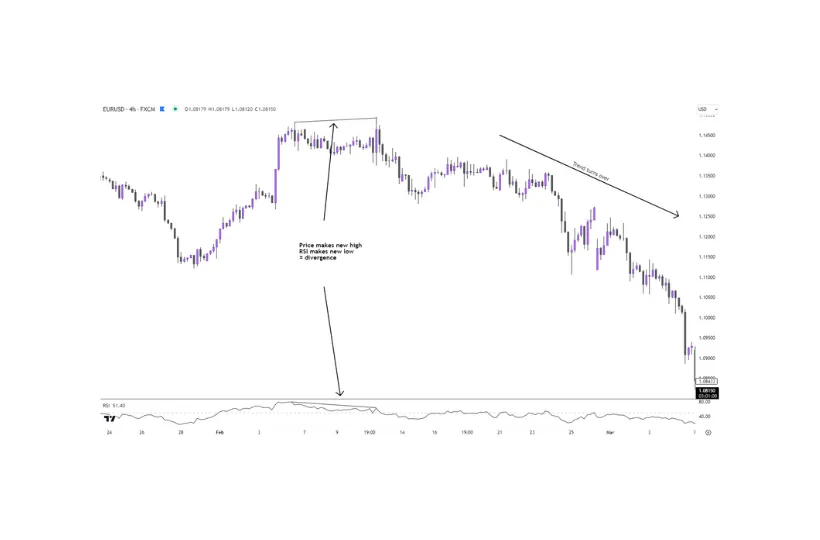
Figure 4 – RSI divergence on EURUSD 4-hour chart.
This method of analysis is heavily relied on by pattern and reversal traders. However, it’s important to note that the lower the timeframe you trade on, the more ‘false’ divergence signals you will encounter, thus making this method of analysis more suitable for longer-term swing traders.
Bollinger Bands
Bollinger Bands consist of a middle SMA line with two outer bands representing standard deviations from this average, creating a channel around price action. The width of the bands indicates market volatility.
Bollinger Bands Strategy for Breakouts and Squeezes:
- Breakout Trading: Price moving beyond the upper or lower band can signal a strong directional move.
- The Squeeze: When the bands contract, it indicates low volatility and a potential breakout in either direction. Traders can prepare for a price move when bands begin to widen after a squeeze.
Figure 5 below shows an example of the contraction (“The Squeeze”), followed by an explosive move upward.
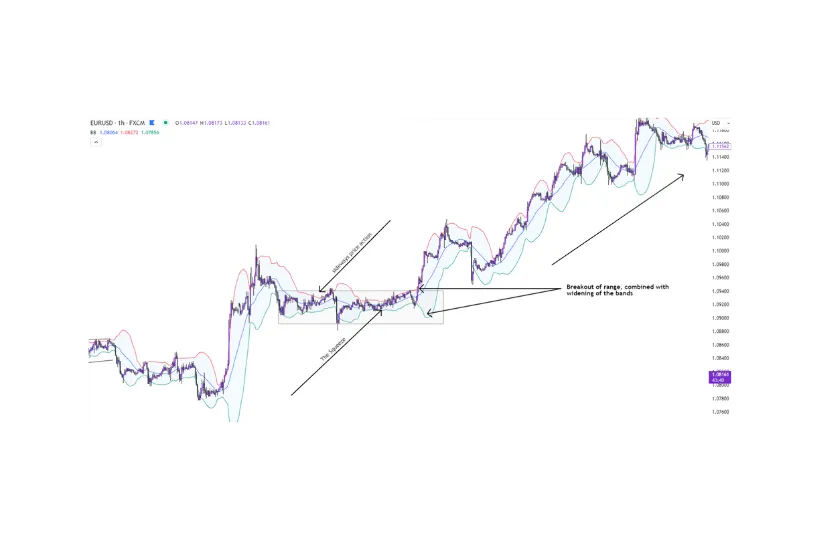
Figure 5 – Breakout trade on 1-hour EURUSD chart using The Squeeze method.
Bollinger bands are typically used with default settings, however, some traders may edit the settings to adapt the indicator to be more closely aligned with their trading stye/strategy.
MACD (Moving Average Convergence Divergence)
MACD is a trend-following momentum indicator that displays the relationship between two moving averages (commonly the 12-day EMA and 26-day EMA).
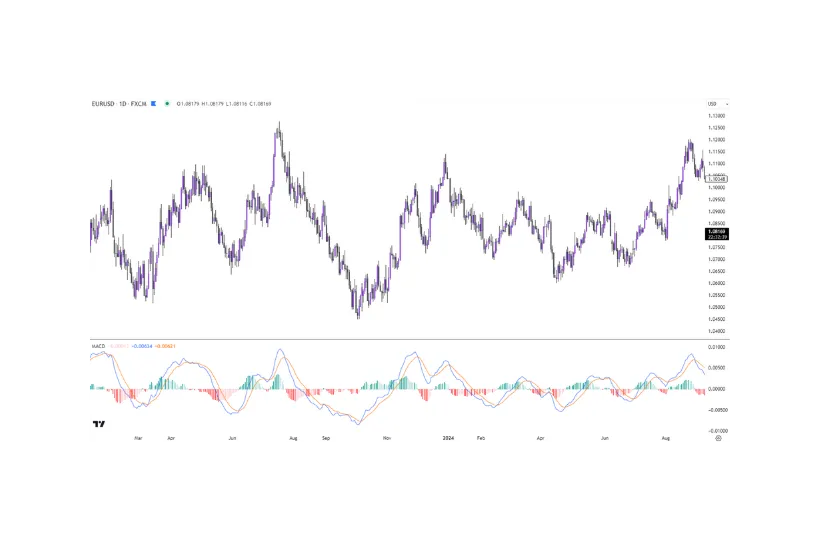
Figure 6 – MACD indicator applied to EURUSD daily chart.
The MACD indicator comprises of:
- Fast line: The difference between the two MAs (blue).
- Slow line: Signal line, which is a 9-day EMA of the MACD line (yellow).
- Histogram: Represents the difference between the MACD and the signal line.
There are many ways to use the MACD in trading. The most common of which, is to identify the end of a trend.
Interpreting MACD crossovers for trend exhaustion:
- Bullish Reversal: The two moving averages are below the zero line, the fast (blue), crosses the slow (yellow) to the upside, and the histogram turns bullish (green).
- Bearish Reversal: The two moving averages are above the zero line, the fast (blue), crosses the slow (yellow) to the downside, and the histogram turns bearish (red).
MACD is often used on higher timeframes to determine whether a current trend is showing signs of exhaustion. In doing so, traders can identify profit-points and/or opportunities for reversal trades.
Fibonacci Retracement
Fibonacci retracement levels are horizontal lines drawn at specific price points that can act as potential support and resistance levels. These levels are derived from the Fibonacci sequence and include 23.6%, 38.2%, 50%, 61.8%, and 78.6%.
How to Use Fibonacci Retracement: Identify a significant peak and trough in the price chart, then draw the retracement lines to determine possible areas of reversal. Many traders use Fibonacci levels to predict areas where pullbacks might end, providing opportunities to enter trades in the direction of the main trend, as shown in Figure 7 below.
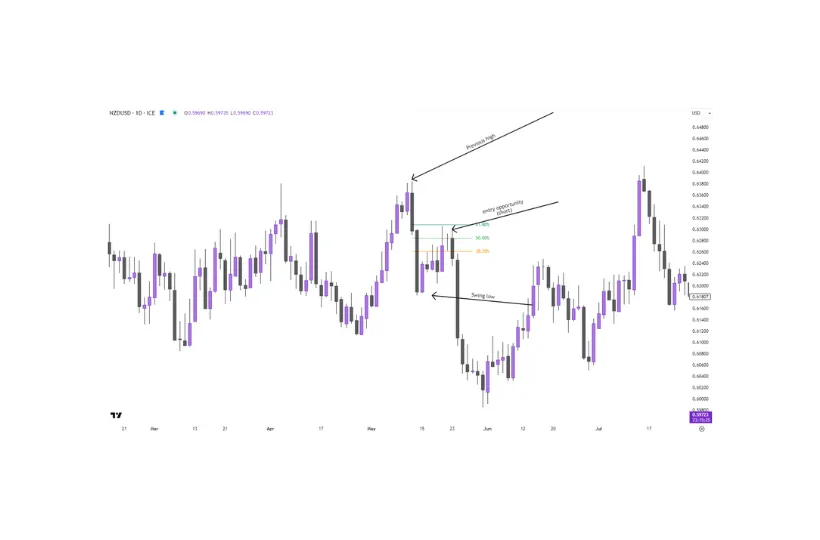
Figure 7 – Example of using Fibonacci retracements for trade entry.
As shown in Figure 7, the Fibonacci tool is drawn from the previous high, to the previous low. In this example, we’ve used the most common retracement levels – 38.2%, 50%, and 61.8%.
Fibonacci levels are effective on all timeframes and work extremely well in conjunction with other technical analysis indicators.
Using and Combining Indicators Effectively
Whilst each indicator provides valuable insights, using multiple indicators can prevent produce more reliable signals. Here are some practical tips:
- Avoid clutter: Using similar indicators (e.g., two momentum indicators) may clutter charts without adding any significant value.
- Complementary combinations: For example, combining RSI with MACD can offer insights into both trend strength and momentum. Additionally, pairing Bollinger Bands with Moving Averages can highlight breakout opportunities and trend directions.
- Multiple timeframes: Balancing indicators across different timeframes allows you to gauge the broader trend while identifying precise entry and exit points.
Every technical analysis indicator has its own strengths and weaknesses, so what might work for one trader, might not work for another
Pros and Cons of Indicators
Here are some Pros and Cons of the indicators we’ve discussed in this blog post;
Moving Averages
- Pros:
- Smooths trends
- Acts as dynamic support/resistance
- Versatile across different timeframes
- Lags in fast-moving markets
- Prone to false signals
- Often requires confirmation from other tools
Relative Strength Index (RSI)
- Pros:
- Identifies overbought and oversold conditions
- Provides divergence signals
- Simple to learn and interpret
- Can generate false signals
- Limited effectiveness in ranging markets
- May stay in overbought or oversold zones for extended periods
Bollinger Bands
- Pros:
- Measures market volatility
- Provides breakout signals
- Makes spotting volatility easy
- Can be complex to interpret
- Prone to false signals
- Does not provide clear directional information
MACD (Moving Average Convergence Divergence)
- Pros:
- Combines trend and momentum analysis
- Generates clear crossover signals
- Histogram visually represents momentum changes
- Lagging indicator
- Less effective in sideways markets
- Can produce false signals
Fibonacci Retracements
- Pros:
- Highlights natural support and resistance levels
- Works well in conjunction with other indicators
- Useful in trending markets
- Placement of levels can be subjective
- Often requires confirmation from other tools
- Not all price pullbacks respect Fibonacci levels
We strongly recommend looking into all the different technical analysis tools and forex indicators available, find the ones that ‘make sense’ to you, and research into how they are calculated and how they were intended to be used. From there, you can adapt the settings as needed to fit your trading style and strategy.
Conclusion
Incorporating the right indicators, whether it’s Moving Averages, RSI, Bollinger Bands, MACD, Fibonacci retracement, or other, can provide a more comprehensive view of market conditions, allowing you to become more confident in your analysis.
Remember, whilst indicators offer insights, they are most effective when personalised to fit your strategy and continuously practiced. So, experiment with these tools, find what works best for you, and let your trading skills evolve.
Remember: Successful forex trading requires a balance of economic insight, technical skill, and disciplined risk management. Stay informed, practise consistently, and adapt your strategies to ever-changing market conditions.
Never Miss a Post
Never Miss a PostWe’ll never share your email with third-parties. Opt-out anytime.
Ready to Start Trading?
Get started live or get a free demo
Govant Building,
BP 1276 Port Vila,
Vanuatu.CT House,
Office No. 9A,
Providence,
Mahe, SeychellesPlatform & Tools
Partner with usFusion Markets 2025. All rights reserved.
*Based on a sample of 70+ global FX/CFD brokers for spreads and commissions conducted by ForexBenchmark as of 1 August 2025 .
**Based on research conducted by Compareforexbrokers on Forex Broker execution speed verified on 6 May 2025.
^Fusion Markets has been named “Best Discount Broker” by Brokerchooser.com. Additionally, Fusion Markets was recognised as the “Lowest Spread Forex Broker” in 2025 by Brokerchooser.com.All financial products involve risk and you should ensure you understand the risk involved as certain financial products may not be suitable for everyone. Trading in margin foreign exchange and derivatives carries a high level of risk and you may incur a loss that is far greater than the amount you invested. Past performance of any product described on this website is not a reliable indication of future performance. Any information or advice contained on this website is general in nature and has been prepared without taking into account your objectives, financial situation or needs. Before acting on any information or advice on this website, you should consider the appropriateness of it (And any relevant product) having regard to your circumstances and we recommend that you seek independent financial advice if necessary. Please read our Financial Services Guide (FSG) and Product Disclosure Statement (PDS) which are important documents, and which are available for downloading from this website.
The information on this website is not intended to be an inducement, offer or solicitation to anyone outside of Australia and is not intended for distribution to, or use by, any person in any country or jurisdiction where such distribution or use would be contrary to local law or regulation. Fusion Markets is not able to take clients from Afghanistan, Congo, Iran, Iraq, Japan, Myanmar, New Zealand, North Korea, Ontario, Palestine, Russia, Spain, Somalia, Sudan, Syria, Ukraine, Yemen, or the United States or its territories. The information on this site is not directed at residents in any country or jurisdiction where such distribution or use would be contrary to local law or regulation.
Gleneagle Securities Pty Limited trading as Fusion Markets EN is a registered Vanuatu company (company number 40256) and is regulated by the VFSC.
Fusion Markets International Ltd as Fusion Markets is a registered Securities Dealer regulated by the Financial Services Authority of Seychelles (license number SD096).
Australian Clients Only: Fusion Markets is a trading name of FMGP Trading Group Pty Ltd (ABN 74 146 086 017) and is regulated by ASIC and licensed to carry on a financial services business in Australia under Australian Financial Services License No. 385620.
https://www.ig.com/en/trading-strategies/10-trading-indicators-every-trader-should-know-190604https://fusionmarkets.com/posts/top-indicators-for-trading-forex
Author
